可缩放矢量图形(英语:Scalable Vector Graphics,SVG)是一种基于可扩展标记语言(XML),用于描述二维矢量图形的图形格式。SVG 由 W3C 制定,是一个开放标准。
应用场景
SVG 的优势
由于 SVG 图像是矢量图像,可以无线缩放 ,而且在图像质量下降方面没有任何问题。因为 SVG 图像是使用 XML 标记 构建的,浏览器通过每个点和线来打印他们,而不是用预定义的像素填充某些空间。这确保 SVG 图像可以适应不同的屏幕大小和分辨率。
由于是在 XML 中定义的,SVG 图像比 JPG 或 PNG 图像更灵活,而且我们可以使用 Css 和 JavaScript 进行交互。
开始
复制 <!-- 定义绘图区域 -->
<svg width="500px" height="500px"></svg>
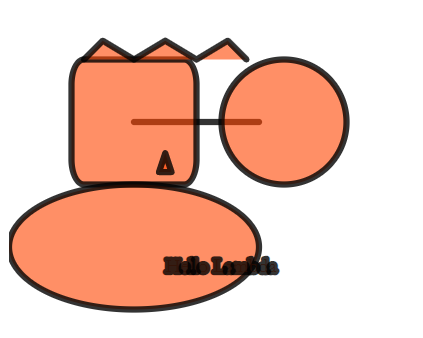
代码示例
复制 <svg width="500px" height="500px">
<!-- 直线 -->
<!-- x1, y1 x2, y2 定义两点坐标 -->
<line x1="100" y1="100" x2="200" y2="100"></line>
<!-- 矩形 -->
<!-- x , y 是起始坐标,width 和 height 是自解释的。rx, ry是定义圆角 -->
<rect x="50" y="50" width="100" height="100" rx="10" ry="20"></rect>
<!-- 圆形 -->
<!-- 半径 圆心 -->
<circle r="50" cx="220" cy="100"></circle>
<!-- 椭圆形 -->
<!-- x轴,y轴 圆心 -->
<ellipse rx="100" ry="50" cx="100" cy="200"></ellipse>
<!-- 折线 -->
<!-- 使用 points 定义多个点 各组点使用逗号分开 -->
<polyline
points="60 50, 75 35, 100 50, 125 35, 150 50, 175 35, 190 50"
></polyline>
<!-- 多边形 -->
<!-- 通过定义多个点 进行连线 -->
<polygon points="125 125, 130 140, 120 140"></polygon>
<!-- 文本 -->
<text x="125" y="220">Hello Lambda</text>
</svg>
/* 使用 css 定义svg样式 */
svg {
/* 线条颜色 */
stroke: #000;
/* 线条粗细 */
stroke-width: 5;
/* 线条样式 */
stroke-linecap: round;
stroke-linejoin: round;
/* 填充 */
fill: #f40;
/* 线条透明度 */
stroke-opacity: 0.8;
/* 填充透明度 */
fill-opacity: 0.6;
}
path 元素
复制 <!-- M指令和L指令 -->
<!-- 一组x和y坐标 -->
<!-- M表示移动到 L表示划线到 Z 表示闭合路径(不分大小写) -->
<path d="M 10 10 L 20 10" />
<!-- m 指令和 l 指令 -->
<path d="m 100 10 l 20 10" />
<!-- H 和 V 命令 -->
<path d="M 100 100 H 200 V 200" />
<!-- Z 命令 -->
<path d="M 100 100 H 200 V 200 Z" />
<!-- A 命令 -->
<!--
rx ry x-axis-rotation large-arc-flag sweep-flag x y
• rx ry 圆弧的x轴半径和y轴半径
• x-axis-rotation 圆弧相对x轴的旋转角度,默认是顺时针,可以
设置负值
• large-arc-flag 表示圆弧路径是大圆弧还是小圆弧 1大圆弧
• sweep-flag 表示从起点到终点是顺时针还是逆时针,1表示顺
时针,0表示逆时针
• x y 表示终点坐标,绝对或相对
-->
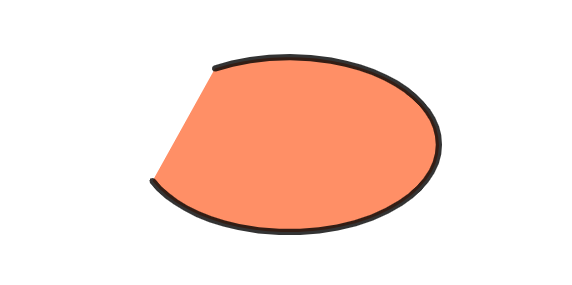
<path d="M 200 110 A 70 120 90 1 1 150 200" />
<!-- Q T 二次贝塞尔曲线 -->
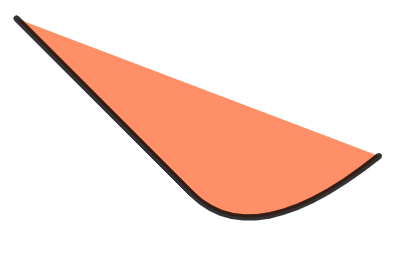
<path d="M 10 10 Q 100 100, 150 150 T 300 120" />
<!-- C S 三次贝塞尔曲线 -->
<path d="M 10 10 C 100 100, 180 280, 200 120 T 300 120" />
绝对坐标和相对坐标
代码示例
复制 <svg width="500px" height="500px">
<path
d="
M 50 50
L 20 100
L 30 100
L 0 150
L 40 150
L 40 250
L 60 250
L 60 150
L 100 150
L 60 100
L 80 100
Z
"
></path>
</svg>
复制 <svg width="500px" height="500px">
<path d="M 10 10 H 110 V 100 H 210 V 200" />
</svg>
复制 <svg width="500px" height="500px">
<!-- 圆弧指令 -->
<!-- rx ry x-axis-rotation large-arc-flag sweep-flag x y -->
<!-- 起点 x半径 y半径 旋转角度 大圆弧还是小圆弧 顺时针/逆时针 终点坐标 -->
<path d="M 200 110 A 70 120 90 1 1 150 200" />
</svg>
复制 <svg width="500px" height="500px">
<path d="M 10 10 , Q 100 100, 150 150 T 300 120" />
</svg>
复制 <svg width="500px" height="500px">
<path d="M 10 10 C 100 100, 180 280, 200 120 T 300 120" />
</svg>
线性渐变
复制 <svg width="500px" height="500px">
<!-- 定义渐变规则 -->
<defs>
<!-- 线性渐变 -->
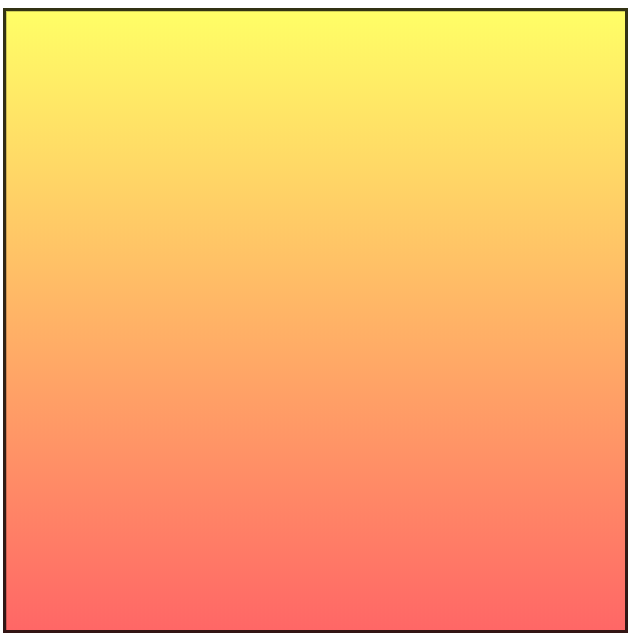
<linearGradient id="bg1" x1="0" y1="0" x2="0" y2="100%">
<stop offset="0%" style="stop-color:rgb(255,255,0);" />
<stop offset="100%" style="stop-color:rgb(255,0,0);" />
</linearGradient>
</defs>
<!-- fill 使用渐变 -->
<rect x="0" y="0" width="500" height="500" style="fill:url(#bg1)" />
</svg>
径向渐变
复制 <svg width="500px" height="500px">
<defs>
<radialGradient id="bg2" cx="50%" cy="50%" r="50%" fx="50%" fy="50%">
<stop offset="0%" style="stop-color:green;" />
<stop offset="100%" style="stop-color:red;" />
</radialGradient>
</defs>
<rect x="0" y="0" width="500" height="500" style="fill:url(#bg2)" />
</svg>
高斯模糊滤镜
复制 <svg width="500px" height="500px">
<defs>
<filter id="Gaussian_Blur">
<feGaussianBlur in="SourceGraphic" stdDeviation="20" />
</filter>
</defs>
<rect
x="0"
y="0"
width="500"
height="500"
fill="”yellow”"
style="filter:url(#Gaussian_Blur)"
/>
</svg>
更多滤镜效果可以访问 http://www.w3school.com.cn/svg/svg_filters_intro.asp
SVG 路径动画
通过控制 SVG 的样式来实现动画
复制 /* 线段间距 */
stroke-dasharray: 100px;
/* 线段偏移 */
stroke-dashoffset: 15px;
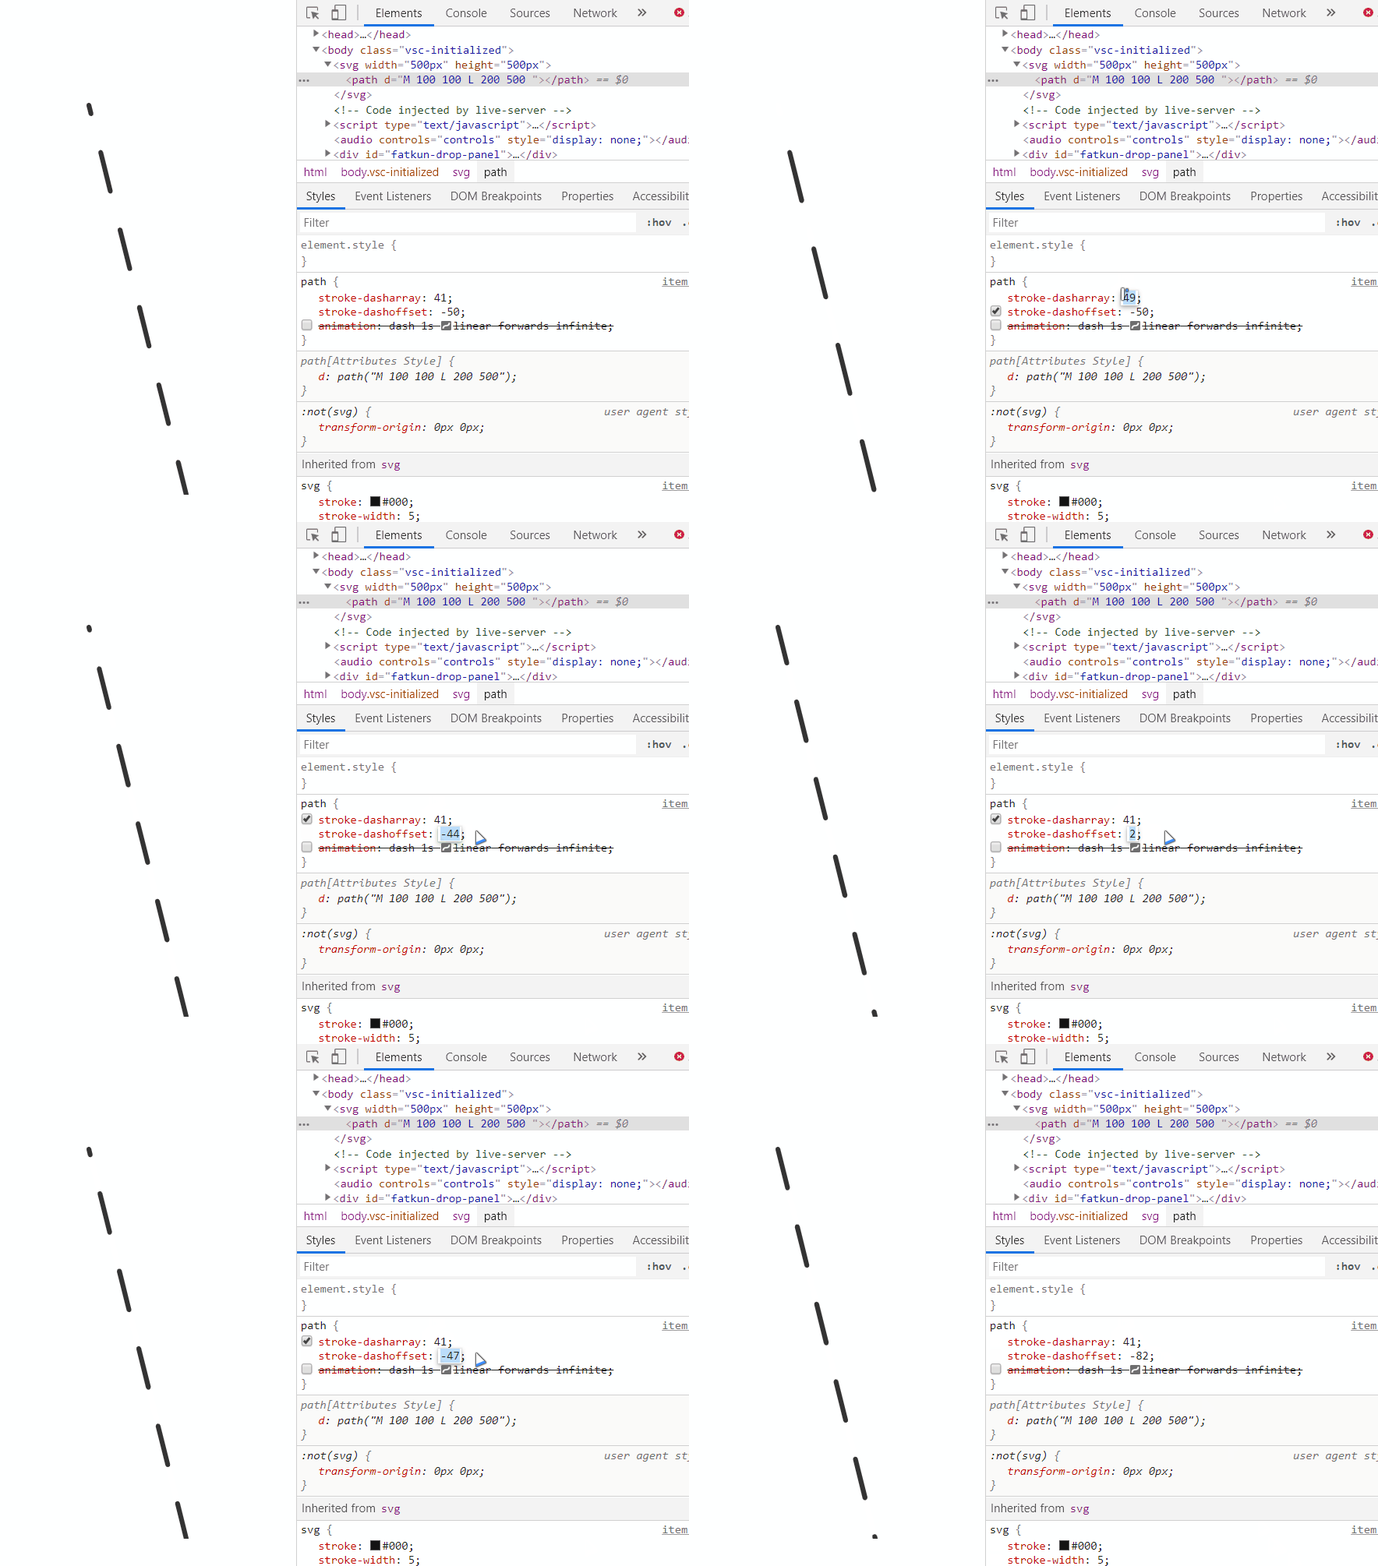
通过修改 stroke-dashoffset 的值让路路径慢慢地展现出来
代码示例
复制 svg {
/* 线条颜色 */
stroke: #000;
/* 线条粗细 */
stroke-width: 5;
/* 线条样式 */
stroke-linecap: round;
stroke-linejoin: round;
/* 填充 */
fill: #f40;
/* 线条透明度 */
stroke-opacity: 0.8;
/* 填充透明度 */
fill-opacity: 0.6;
}
path {
stroke-dasharray: 41;
stroke-dashoffset: -82;
animation: dash 1s linear forwards infinite;
}
<svg width="500px" height="500px">
<path d="M 100 100 L 200 500 " />
</svg>
可以通过 getTotalLength()
函数获取到 path 路径总长度
可以通过 getPointAtLength(X)
函数获取路径上距离起始点距离 x 长度的点的坐标
JS 生成 SVG 元素
SVG 元素对象一般通过调用 setAttribute() 方法来设定属性值
复制 let char = 'http://www.w3.org/2000/svg',
svg = document.createElementNS(char, 'svg')
svg.setAttribute('width', 500)
svg.setAttribute('height', 500)
svg.setAttribute('viewBox', '0 0 500 500')
let rect = document.createElementNS(char, 'rect')
rect.setAttribute('x', 100)
rect.setAttribute('y', 100)
rect.setAttribute('width', 100)
rect.setAttribute('height', 100)
rect.setAttribute('fill', '#0fc')
svg.appendChild(rect)
document.body.appendChild(svg)
高性能 SVG 优化清单
canvas 和 svg 区别
从图像类别区分,Canvas 是基于像素的位图,而 SVG 却是基于矢量图形。可以简单的把两者的区别看成 photoshop 与 illustrator 的区别。
从结构上说,Canvas 没有图层的概念,所有的修改整个画布都要重新渲染,而 SVG 则可以对单独的标签进行修改。
从操作对象上说,Canvas 是基于 HTML canvas 标签,通过宿主提供的 Javascript API 对整个画布进行操作的,而 SVG 则是基于 XML 元素的。
从功能上讲,SVG 发布日期较早,所以功能相对 Canvas 比较完善。
关于动画,Canvas 更适合做基于位图的动画,而 SVG 则适合图表的展示。
从搜索引擎角度分析,由于 svg 是有大量标签组成,所以可以通过给标签添加属性,便于爬虫搜索